Updating an Estimate of the Source Apportionment of Nitrogen to Waters in England and Wales
WQD0002
May 2004
EXECUTIVE SUMMARY
Background
As part of its work on the Government's Strategic Review of Diffuse Water Pollution from Agriculture (DWPA), the Department for Environment, Food and Rural Affairs (Defra) commissioned WRc to investigate the feasibility of producing, in a short study, an update of the estimate of the relative magnitude of different sources of nitrogen to waters in England and Wales made by the Royal Society in 1983.
The report of that ("Phase 1") work briefly reviewed current UK source apportionment estimates, and more recent work undertaken in Sweden and Germany. It concluded that whilst detailed, integrated approaches in the manner of the German and Swedish work would not be feasible in a short study, a worthwhile update of the N source apportionment was feasible. An abridged version of that report is appended as Annex 2.
Defra then commissioned WRc, with input from ADAS, to produce an updated estimate as proposed in the Phase 1 report. This ("Phase 2") report describes the work undertaken and the results obtained.
Methods
The methods used were, in general, those described in the report of Phase 1 (see Annex 2): (i) inputs from agricultural and other land (except urban land) were estimated by the ADAS MAGPIE model, (ii) inputs from sewage treatment works effluents were estimated from Ofwat submissions by the water companies and expected N loads from different types of treatment plant, and smaller inputs were estimated by a variety of appropriate means. The results were compared with (a) the Royal Society N source apportionment of 1983, (b) a recent N source apportionment for Germany, and (c) another for Sweden. They were also used, with in-river load estimates from Harmonised Monitoring data, to estimate in-river loss coefficients for comparison with data on mainland European rivers.
Results
Background
In considering the results, the following should be noted:
N load and source apportionment
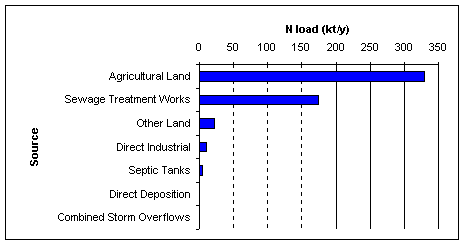
The apportionment of the total estimated total load of 544 kt N/yr (2000/2001) between the various sources is shown in the following bar chart.

It should be noted that:
Comparison with Royal Society (1983) data
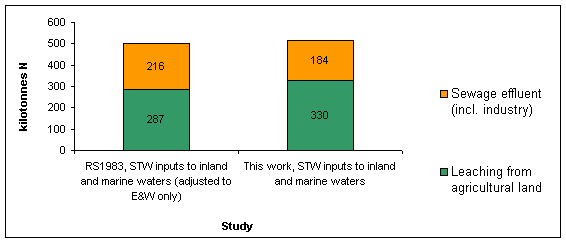
Comparison with the previous apportionment for the two major N sources made using the Royal Society (1983) study group data (including STW discharges to both inland and marine waters) is shown in the bar chart below.

This shows the estimated N input from agricultural land to have increased by about 15% between 1983 and 2003, and the estimated inputs from sewage treatment works to have declined by about 15%. The latter decline is believed to result primarily from improvements in STW discharges to the marine environment, undertaken to meet legislative requirements, and possibly also from over-estimation of N levels in STW effluents in the Royal Society estimates of 1983. It should also be noted that the population has grown significantly (about 4%) since 1983, which - other things being equal - would have been expected to increase STW N loads by a similar percentage.
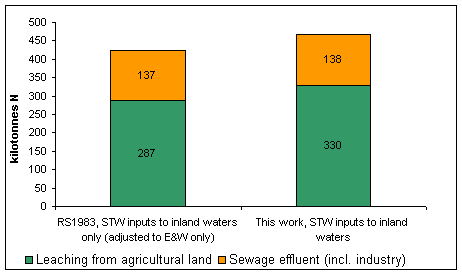
A similar comparison , but including STW discharges to inland waters only, is shown in the next bar chart.

This again of course shows the estimated N input from agricultural land to have increased by about 15% between 1983 and 2003, but also shows the estimated inputs from STWs discharging to inland waters to be essentially unchanged.
In relation to the above comparisons, it should again be noted that the estimates of N inputs from agricultural land will not reflect any recent changes in the amount/pattern of fertiliser and manure use, and that not all recent STW improvements may have been reflected in the source data.
Comparison with estimates for Germany
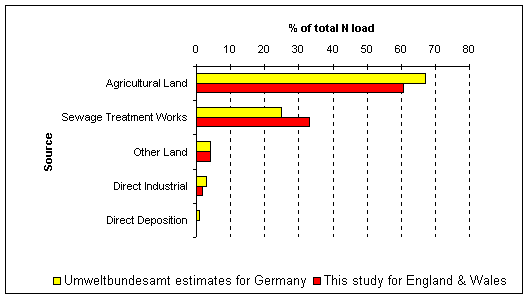
As the following bar chart shows, the estimated relative contributions of the different N sources are broadly similar for the two countries, although the estimated relative load from STWs is higher, and that from agricultural land lower, for England and Wales.

However, the England and Wales total load, at 544 kt N, is substantially higher than the German total load adjusted for the difference in size of the countries (by population and land area, according to the nature of the source component), at 388 kt N. The reasons for the differences are not known, but are likely to include different sewage treatment and agricultural practices.
Estimation of N losses in rivers
The in-river loss coefficients derived from the data compare reasonably well with those estimated for mainland European rivers, though the estimated in-river loss coefficient for Wales is lower than those typically estimated for continental European catchments.
Recommendations for further work
Recommendations are made for work to provide Defra with a robust tool to update the N source apportionment in future, to improve the estimates of certain sources and to facilitate sensitivity analysis to quantify likely uncertainties.
Copies of this report may be available as an Acrobat pdf download under the 'Completed Research' heading of the Research Page on the DWI website.