Wastewater Forum Archive
WASTEWATER RESEARCH AND INDUSTRY SUPPORT FORUM
Meeting 28th November 2003
Please note that for older reports some links will be to sites that are no longer active.
Tim Evans reviewed this year’s FWR-WaPUG workshop entitled “Design Criteria & Performance Standards for Urban Drainage Systems Is Historic Practice Still Good Enough?”. Basically the answer was “no”, however that’s not to say that things are bad at present but that in a changing climate (meteorologically and otherwise) it is time to question and move forward; we could and should do better. Climate change is now accepted by most as being a reality and there is a strong probability that rainfall events are going to be more intense. There is continuous creep of impervious surface (roads, parking, roofs, conservatories, patios, etc.) so there is less infiltration and more instantaneous run-off. Inevitably these intense discharges of water will exceed the capacity of the underground drainage more often.
We could increase the capacity of the underground drains at huge cost and disruption or we could keep the rainwater out of the foul drains by surface drainage, infiltration, delaying the flow and designing and designating flood routes. The latter would require cooperation and sharing of responsibilities across the existing organisational and legislative boundaries; making the necessary changes would be hard but ultimately more sustainable.
An example from Glasgow showed that engaging with the public so that they can appreciate the issues and the alternative costs and outcomes enables them to buy into the solutions. This is probably more acceptable than ‘decide and dictate’. It is important that jargon does not hinder comprehension.
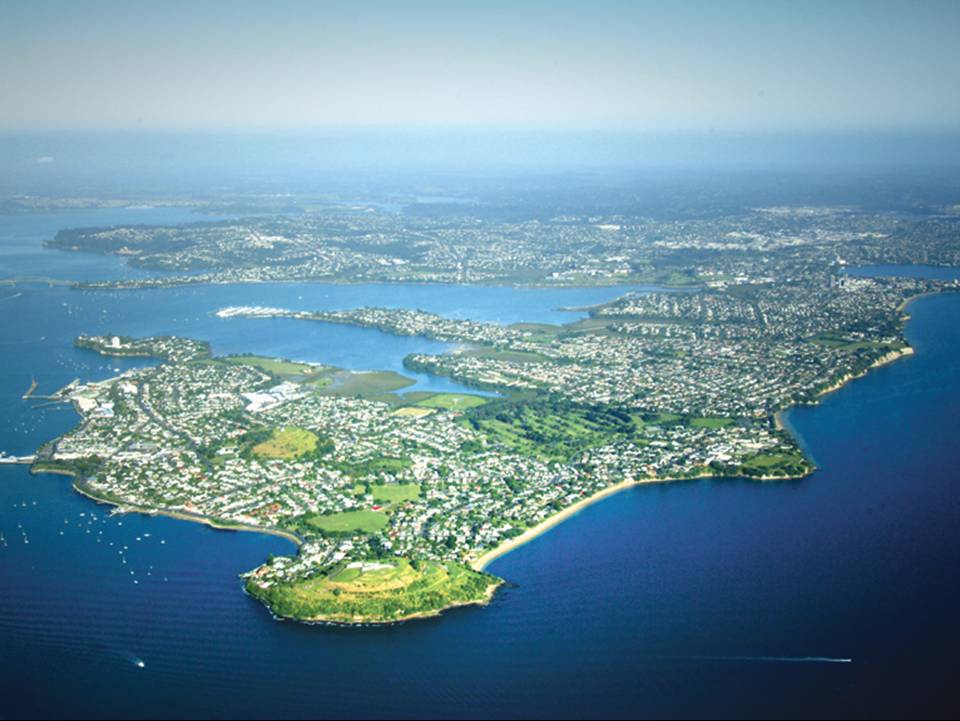 Joel Cayford talked about “Managing Urban Drainage in Auckland NZ”. Joel is a PhD atomic physicist turned Councillor for North Shore City Council, Auckland, and editor of www.watermagazine.com. North Shore City is one of 5 administrations in Auckland, it has 148 km of coastline· 13,000 hectares land area 9,400 hectares served by its stormwater system 3,300 hectares of impervious area (35 percent of the land area). The predominant soil type is clay. The average annual rainfall is 1250 mm. Development to maintain water quality is sensitive. There has been a sharp change in conciousness and expectation in the last 5 years. Local councillors in NZ generally run as independents; the local newspaper had been raising awareness of the drainage/water-quality issue for several years; Joel was elected on a sewerage ticket! A high proportion of the population of North Shore City, Auckland has degrees. The rates are approximately equal thirds: sewerage (approx. $400/year), property charge related to value, and water usage (at $1/m3).
The sewerage systems was modelled with full dynamic calibration following 12 months gauging of 34 sewer catchments in 1997 with 6 local rain gauges. The bacterial impacts of storms were measured. This showed that on an annual basis the loads were WwTP discharge 3%, sewer overflows 14% and stormwater 83% but that during some storm events the load from sewer overflows could constitute >50%. The quantification of the WwTP’s contribution is regarded as politically important because it avoided diversion of resources to a discharge of low relevance. Microbial speciation showed the contribution from dog and other pet faeces is minor.
The “do nothing” option would have been to accept twice monthly beach closures because of excessive bacterial counts; this was not publicly acceptable. It was decided to invest $280 million which would reduce beach closures to two times per year. The options for reducing wet weather overflows were: repairing and replacing pipes to reduce inflow and infiltration, increasing the capacity of pipes and pumps to accommodate transport of excessive flows, adding storage facilities to contain excessive flows and increasing reliability to reduce dry weather overflows. A cost optimisation program was run to obtain the mix that would achieve a required performance (containment standard) at least costs. This was an iterative process using: SEWCOM, which uses capacity / costs relationships. The programme involved an extensive rehabilitation program in the leakiest catchments, overflow storage tanks were built underground at 4 locations and the trunk sewers in 1 village were replaced with 1.8 metre diameter pipes to increase capacity and provide flow attenuation.
The trend has been for continuous increase in impermeable areas, greater stream erosion, less open space (less stream recharge) and more cars. The city has decided it wants to reduce impermeable surfaces, minimise erosion, stabilise stream channels, minimise change to base flows in streams and reduce emissions from cars.
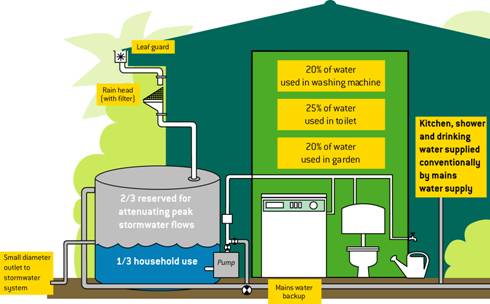
North Shore City plans innovation to attenuate flows. It wants to use the volume underneath paved surfaces for flow attenuation by incorporating 1m depth of porous aggregate (i.e. no fines) encased in geotextile, the paved surface and margins thus become swales. New houses will be required to install 5m3 rainwater storage tanks (with diversion of the first flush of roof drainage); 3.3m3 will be reserved for storm attenuation and 1.7m3 will be for household use for toilet flushing, garden watering and washing machine use. Apparently this is also practised in Germany and it is quite satisfactory without any treatment. In some areas of existing development where there is flooding the council is paying to install these tanks to attenuate storm discharge as a less expensive alternative than increasing the sewer capacity.
Continuous communication to keep the electorate informed is regarded as having been very important.
The final topic of discussion was to discuss “How is PR04 developing?”
Simon Walster gave OFWAT’s perspective. PR99 has provided for £15bn capital and £2.5bn annual operating expenditure, whilst at the same time delivering an aversage reduction in bills of £30 per year by 2005. The lessons learned from the exercise were that it had taken too long, too many submissions (14) were required and the process was not transparent enough. The aim for PR04 was that it should only take 2 years ,[but in reality it will be 3] only 4 submissions are required and the financial model is available outside OFWAT. Draft determinations are scheduled for July 2004 and final determinations in November 2004; the new price limits will come into effect on 1st April 2005. OFWAT `has built an Access relational database to capture and analyse information, this will enable better modelling of project forecasts but there is no intention at present to capture outturn expenditure. This was seen by the Forum as regrettable because the only information in the public domain is the very elderly WRc TR61 updated; it was imprecise in the 1980s when it was first published and with inflation and changes in construction techniques it is hopelessly out of date, but it’s all that we have.
OFWAT considers that preparing draft business plansd has been worthwhile because it has helped each company to clarify its strategies for 2005-10 and it has helped OFWAT understand issues where companies’ thinking needs testing and justifying for consistency. OFWAT publish a summary in October 2003 as a basis for advising Ministers. The average household bill in 2004-5 will be £234 and in 2009-10 it is expected to be £306. Enhancements in drinking water quality add £10, improving environmental quality £26; maintaining security of supply (replacing aged infrastructure, etc.) adds £12; capital maintenance adds £19; addressing sewer flooding and odour add £5; operating costs (including increasing inability to cut of fnon-payers) and tax add £16; this total of increases (£88) will be offset by even further efficiency savings of £18.
The contracting and equipment supply companies have complained that this 5-yearly planning cycle results in years of very low activity and other years of manic activity. Some UK companies have pulled out of the water sector saying the feast and famine is commercially unacceptable. Others have said that they are unable to invest in R&D because when they have positive cash-flow they are over-stretched trying to satisfy clients and when they have time in which they could undertake R&D they have no income. OFWAT estimates the variation in capital spend has been £4bn in some years and £3bn in others; in earlier plans companies have delayed schemes to earn interest on the unspent income. In recognition of (and an attempt to alleviate) the problem OFWAT proposes an “Early-Start” programme, which will nominate some schemes for early-start that are uncontentious and clearly needed. These schemes will be confirmed on 19th December and completion will be required by December 2006.
Regarding the main programme, Minister’s principal guidance is expected 29th January 2004; final business plans 7th April 2004, draft determinations 28th July 2004 and final determinations 25th November 2004. Certainly the philosophy has changed, in previous rounds there was a strong political agenda to drive bill down to an undisclosed amount; the PR04 philosophy is “prices will be no higher than they need to be”.
Gerard Morris reported that the EA is examining the likely effect on fisheries and the likely effect on complying with the Freshwater Fisheries Directive.
Brian Crathorne from Thames Water gave the water industy’s view of PR04. In spite of the intentions the process started in May 2002 and the new prices will not be effective until April 2005 so it is still 3 years. There have been things that have gone better than previous AMPs: PR04 has been more transparent, the draft business plan helps prepare for the final plan; the benefits assessment has been more realistic (although still flawed); there has been better feedback from OFWAT; there appears to have been pre-conceived ideas on acceptable price and PR04 has been less ‘political’ than previous AMPs. Some things have gone less well: there have been massive information requirements, e.g there has been the Company preferred plan plus two reference plans (A and B) and 3 draft plans have had to be prepared. The information to generate robust costs has been incomplete; there has been insufficient time to prepare fully integrated draft plans and in total it has been the most complex PR ever.
In the past the model has been “bottom up” based on business need, legal requirements, customer expectations, shareholder returns, etc. but this has run into the political aspect of what is considered an acceptable rise in bills. Effectively this has resulted in a price cap and Ministers have had to attempt to resolve the conflict between business need and political  acceptability by issuing Ministerial Statements. Privatisation did not exempt the water industry from political interference. Since privatisation investment has focused on quality and environmental improvement. The original thinking was that Q spend would be largely finished by 2000 -2005. By 2005 Q investment will be around £20 billion and it is not slowing down. Customers have enjoyed bills rising only slightly with inflation, there have been considerable efficiency savings to offset the cost of investment but to remain inside the price cap there has been low maintenance spend, low rates of replacement and long implied asset life. The history has been major improvements in drinking water/environmental quality since privatisation and a huge investment programme. AMP1 – drinking water quality, STW improvements, COPA II; AMP2 – focus on environmental improvements; STW compliance (UWWTD), Bathing Waters; AMP3 – further environmental improvements, sludge treatment, CSOs, Bathing Waters, Fish Directive; AMP4 – nutrient removal, more CSOs, Waste Incineration Directive, more Fish Directive and AMP5 – Framework Directive, Bathing Waters, Drinking Water. The improvements in river quality have been impressive but the effects of being prevented from investing in maintenance of (underground) infrastructure are being seen as increases in leakage, collapses and flooding. The PR04 submissions seek to correct this.
PR04 is the most complex ever; tensions between Q, supply/demand, enhancements and base remain, but it looks as if there will be a better balance this time. There are many uncertainties going into AMP4 – Habitats Directive, UWWTD infraction, lead communication pipe replacement, bad debt, Marcic, security measures. IDOKs will be more common and significant price rises are inevitable – “prices will be what they have to be”.