Development of Models to
Facilitate the Provision of Free Basic Water in Rural Areas
Report No 1379/1/05:
March 2005
Executive Summary
The Free Basic Water Policy was officially implemented in July 2001.
The policy was rolled out in most urban areas on or near this date.
However, in rural areas it was much more difficult, and there are many
areas that have not yet seen the implementation of Free Basic Water
(FBW). This is due to varying financial, technical, political and
logistical problems at the local and district municipality level.
This research investigates the current situation in rural
municipalities, looking specifically at FBW policy, institutional
arrangements, operation and maintenance costs, cost per capita and
affordability in relation to the Equitable Share allocations. Five case
study areas were chosen: the uThukela Water Partnership (KwaZulu
Natal); the Alfred Nzo District Municipality (Eastern Cape); the
Ngqushwa Local Municipality (Eastern Cape); the Vulindlela Water Scheme
(KwaZulu Natal) and the Nlhungwane Community Scheme (Kwa Zulu Natal).
From this research it is clear that Water Service Authorities (WSA) are
at varying levels of implementation, with few having a fully
operational policy that is reaching the rural areas. Some communities
have not been informed about FBW and are still paying for all their
water.
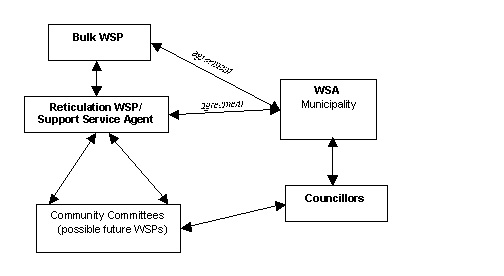
The institutional arrangements for FBW implementation are unique to
each WSA, but a common factor in efficient, cost effective provision
was noted to be the contracting of an organisation with the expertise
and capacity to successfully manage water provision within a budget. An
example of such an arrangement is found in the organogram below:
Figure 1: Cost effective
institutional arrangement for water provision
For each case study area the operation and maintenance costs were
determined (as far as possible), and from this, the cost per capita per
month for water provision. One recurring cause for concern was the lack
of asset replacement costs in WSA budgeting. This will cause a major
problem in the future when infrastructure needs to be replaced. It was
noted where a WSA had not developed a FBW policy an ad hoc, unreliable
operations and maintenance system tended to be in place, with higher
costs than encountered where a reliable, comprehensive service was
provided. This highlights the need for WSAs to prioritise FBW,
regardless of their budget restraints, as FBW-by-default could result
in greater expenditure than if the time, resources and budget are
allocated for the development of a sound FBW policy and implementation
strategy.
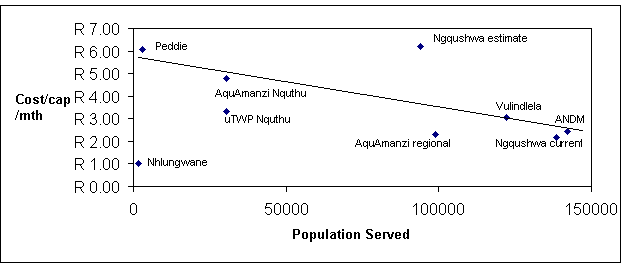
There was a large range in costs per capita, with a trend that showed
the influence of economies of scale. This is illustrated in the graph
below (Figure 2) that shows the benefits of a water service provider
covering a large population.
Figure 2: Correlation between
cost per capita and population served
The median of these per capita costs was used as a recommended cost per
capita to which WSAs could align their budgets. This cost has proven to
be attainable by service providers in different environmental,
financial, social and political environments encountered in this
research. This recommended cost per capita per month is as follows:
R3.51 (operations and support) + R2.33 (asset replacement)
= R5.84 Total cost /capita/month
(in 2004/2005 value)
For poor rural areas the affordability of FBW is primarily determined
by the Equitable Share (ES) allocations. These allocations,
when compared with the median cost calculated above, show that the ES
allocations are insufficient to cover the operation and maintenance
costs in all but one of these rural areas. Table 1 shows the portion of
the ES that is allocated by National Treasury for the supply of water
and divides this grant money (at R5,84 per capita per month) by the
population served by the water service provider. The last two columns
show the percentage of the population that the grant can cover, and the
percentage cover that is currently required at reported indigence
levels and service levels. This shows that even if it is taken into
account that, for example, only 80% of the population should qualify
for FBW, and that only 55% of the population currently have access to
potable water, the ES is insufficient to supply for this portion of the
population.
Table 1: Affordability of FBW
| |
ES allocated for water |
WSA Popln
(Census 2001) |
Recommended Cost/cap/mnth |
% cover possible at recommended
cost/c/m |
% cover needed at present levels of
service provision
and indigency |
| uTWP |
R40,986,809 |
1
581 480 |
R5.84 |
37% |
43% |
| Alfred Nzo DM |
R35,699,689 |
550
389 |
R5.84 |
93% |
57% |
| Ngqushwa |
R2,984,680 |
84
229 |
R5.84 |
51% |
60% |
| Vulindlela (uMsunduzi) |
R13,673,977 |
553
223 |
R5.84 |
36% |
48% |
However, the situation at Alfred Nzo DM is encouraging, and should be a
motivating factor to other WSAs to implement FBW formally within their
entire jurisdiction. The reasons for the high ES grant to the Alfred
Nzo District Municipality are most likely: accurate indigence
statistics and a high level of FBW implementation. The Free Basic
Services Grant is determined by the number of people actually being
provided with the services. Therefore, as the other WSAs increase their
levels of provision, the grant allocation will increase. However, the
problem of differing indigence statistics is more difficult to rectify.
National Treasury only supplies grant finances for the indigent
households as determined by the latest Census statistics. These
statistics differ significantly from the indigence statistics used by
the municipalities in this research. An example of this problem is
demonstrated in uMzinyathi DM, one of the DMs in the uThukela Water
Partnership: Census 2001 gives and indigency level of 72%, while the
Water Services Development Plan for the DM gives an indigency level of
93%. This discrepancy translates into approximately 100 000 people that
are not provided for by the ES.
These problems with affordability highlight the need for WSAs to have
effective and efficient cost recovery systems that ensure payment for
water by those that are not poor, and by all users who consume more
than the free basic allowance. Cost recovery was a noted problem in
each of the case study areas and needs practical and politically
acceptable solutions if FBW is to be sustainable.
Free Basic Water in the rural areas of South Africa is difficult, but
possible. With good management FBW could be sustainable in the long
term as long as national government provides sufficient levels of
Equitable Share revenue to municipalities. From the lessons learned in
this research, the key factors in successful implementation are: good
planning; the honest assessment of the WSA capacity and the
consequential contracting of experts to fulfil the roles and
responsibilities they cannot; political support for FBW policy; and
accountability.


